Viewing Logs for your Flightcontrol Project
Your Flightcontrol projects run on Amazon Web Services (AWS) and use AWS CloudWatch for runtime logging.
We provide web-based log viewers for the Build Logs and Runtime Logs in the Flightcontrol Dashboard.
If your project has a problem deploying, we’ll also show you the logs from the deployment error in the Flightcontrol Dashboard.
In this guide, we’ll explain the differences between the three different log types that Flightcontrol deploys create, and then explain how to view each different type of log.
Log Types
Flightcontrol deployments have three different types of logs:
Build Logs
When you use the Nixpacks build type or the Custom Dockerfile build type, Flightcontrol kicks off a build process to turn your source code repository into a Docker image.
With the Nixpacks build type, you will find the plan for the Nixpacks build as part of the build logs output. A sample from a Flask build with Nixpacks is shown below:
...
10:57:40 AM:
10:57:40 AM: ╔═══════════════════════════════ Nixpacks v1.6.0 ══════════════════════════════╗
10:57:40 AM: ║ setup      │ python38, gcc                                                   ║
10:57:40 AM: ║──────────────────────────────────────────────────────────────────────────────║
10:57:40 AM: ║ install    │ python -m venv /opt/venv && . /opt/venv/bin/activate && pip     ║
10:57:40 AM: ║            │ install -r requirements.txt                                     ║
10:57:40 AM: ║──────────────────────────────────────────────────────────────────────────────║
10:57:40 AM: ║ start      │ gunicorn --bind 0.0.0.0:3000 wsgi:app                           ║
10:57:40 AM: ╚══════════════════════════════════════════════════════════════════════════════╝
10:57:40 AM:
...
Both the Nixpacks and the Dockerfile builds will also show the output for the Docker image creation. You can use this to examine exactly what is being included.
Click a deployment in your Flightcontrol dashboard, and then click the name of the service to view its logs. You’ll find the build logs in the Building section.
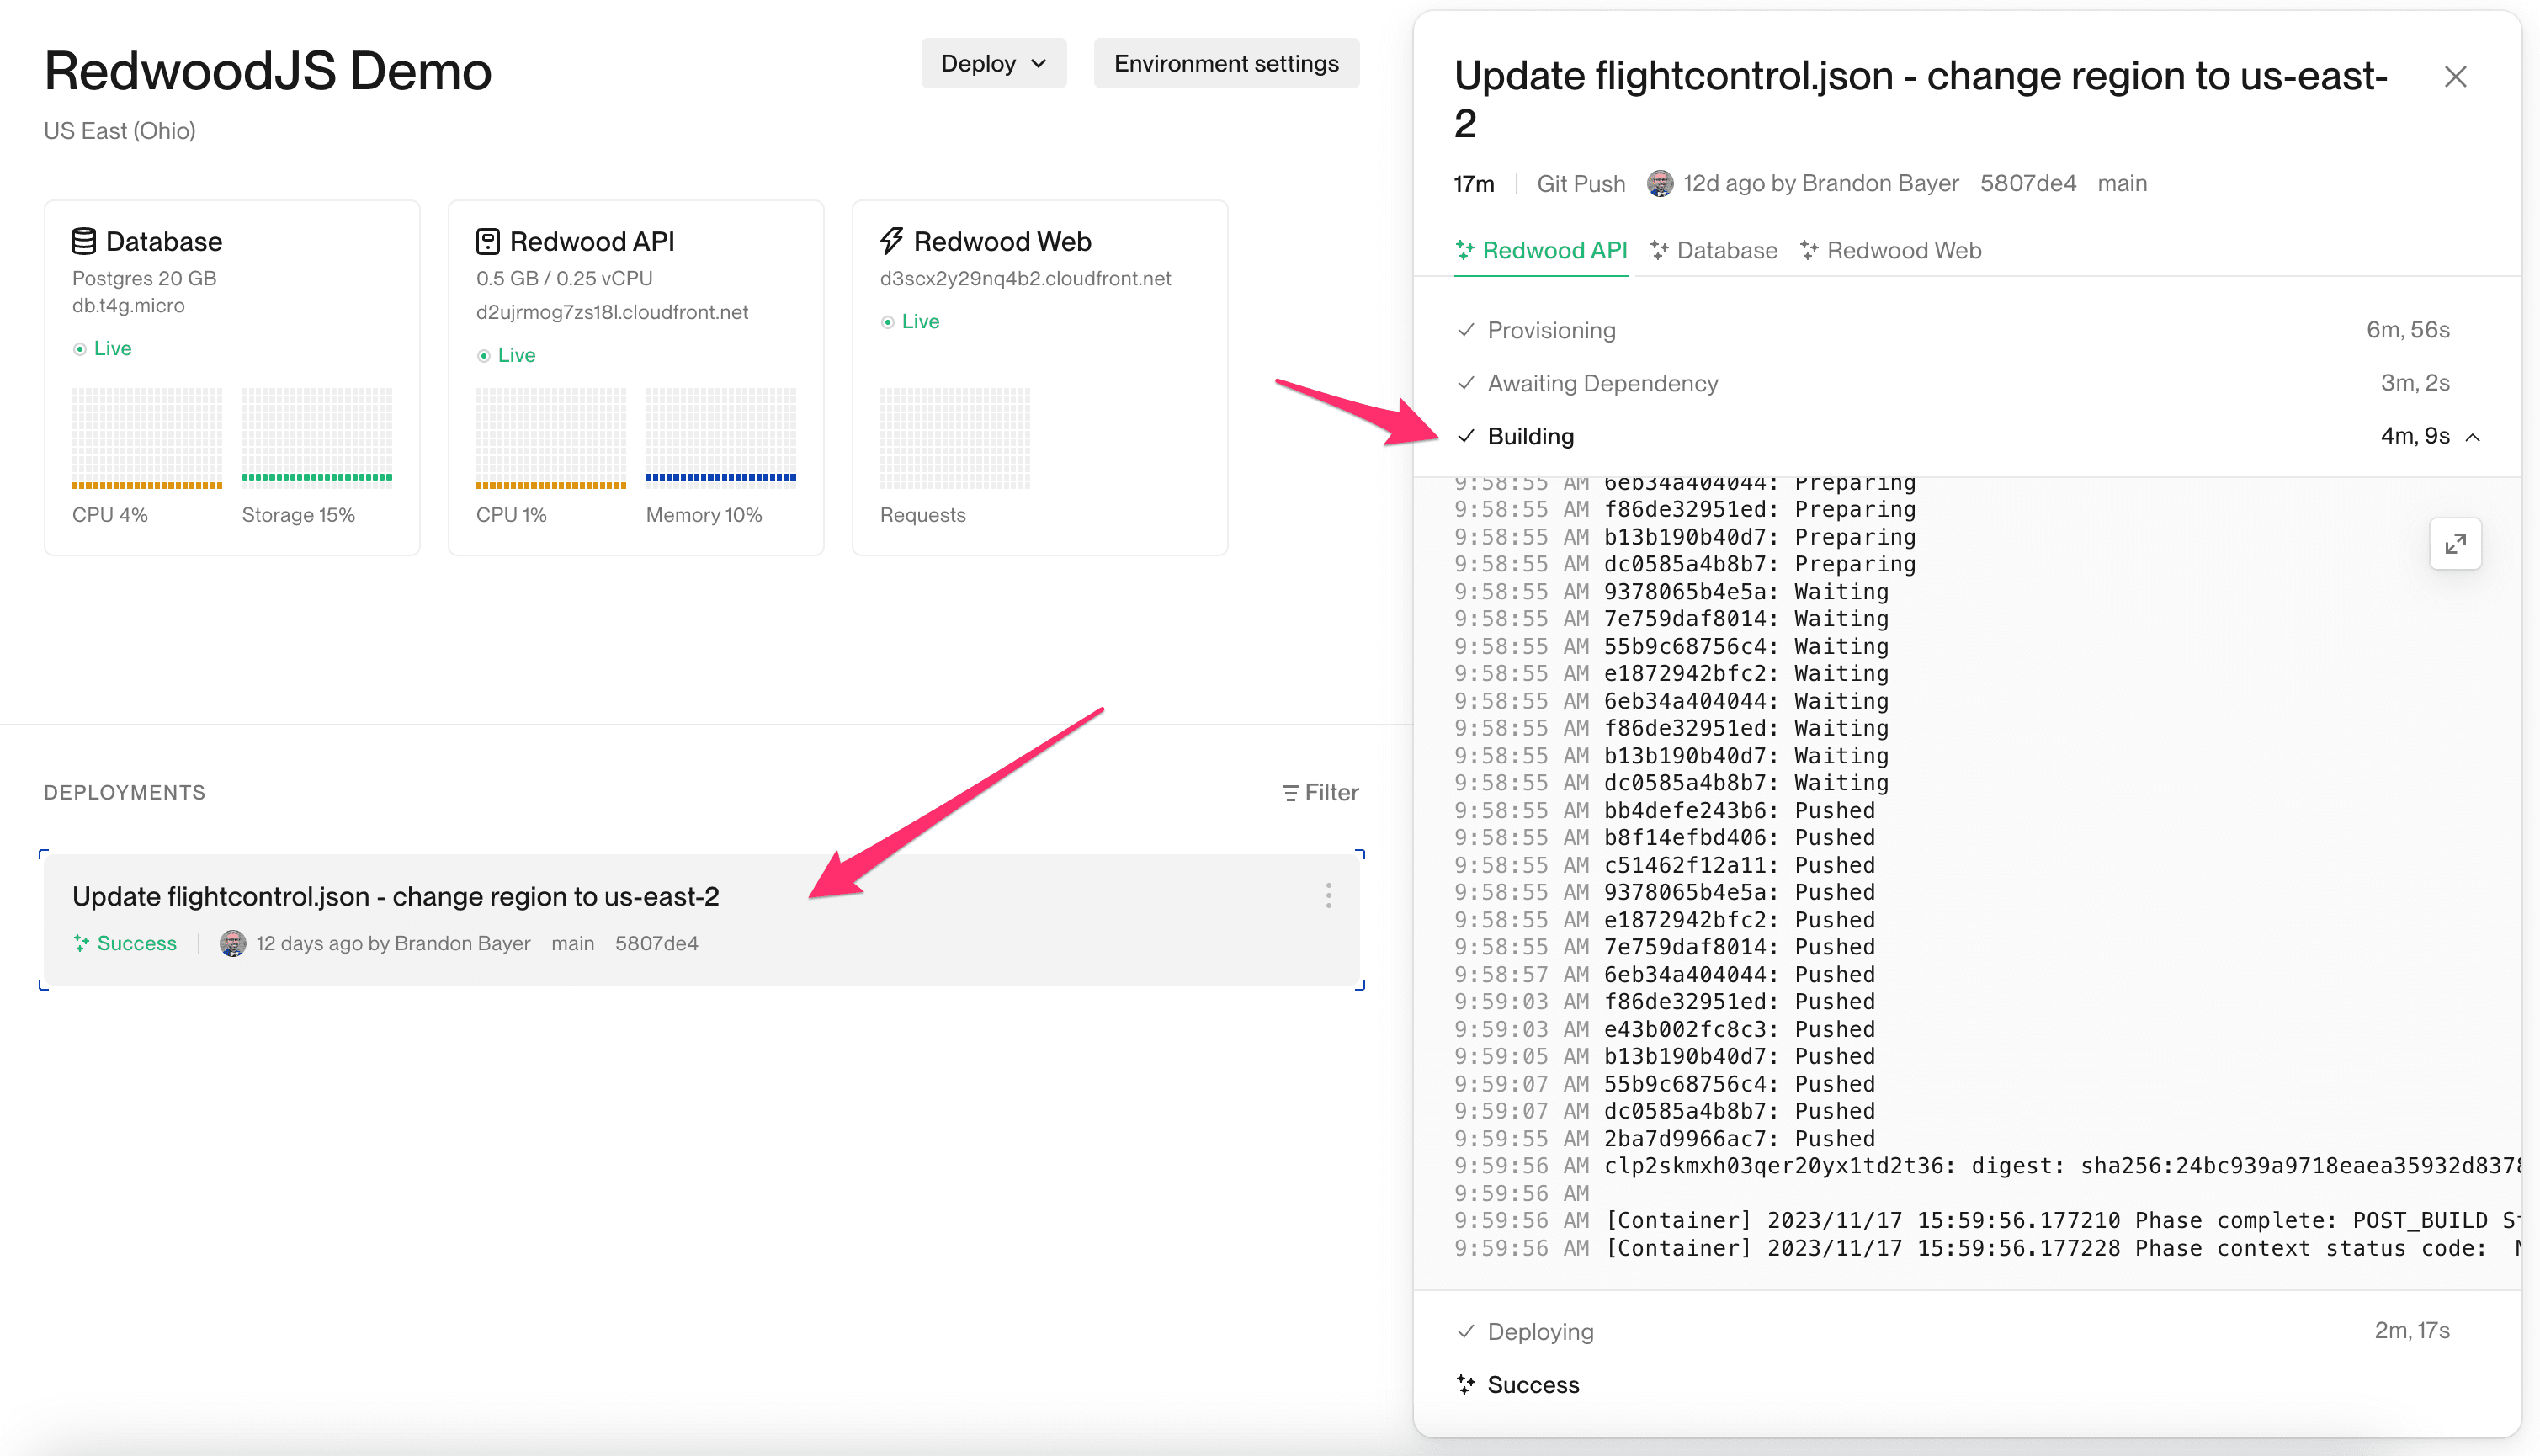
The build logs should always be available for any deployment, whether there is a success or a problem.
Deployment Error Logs
Deploy logs appear after a build is successfully created, during the initial deploy process. The deploy logs will remain available if the deployment fails, and the application is unable to successfully start serving traffic. If the deployment is successful, the same information will be available in the runtime logs.
These deploy logs are very useful as a debugging tool for failed deployments, because you can find out exactly what went wrong.
AWS CloudWatch stores the deploy logs. These are the standard output written out by your application’s start process.
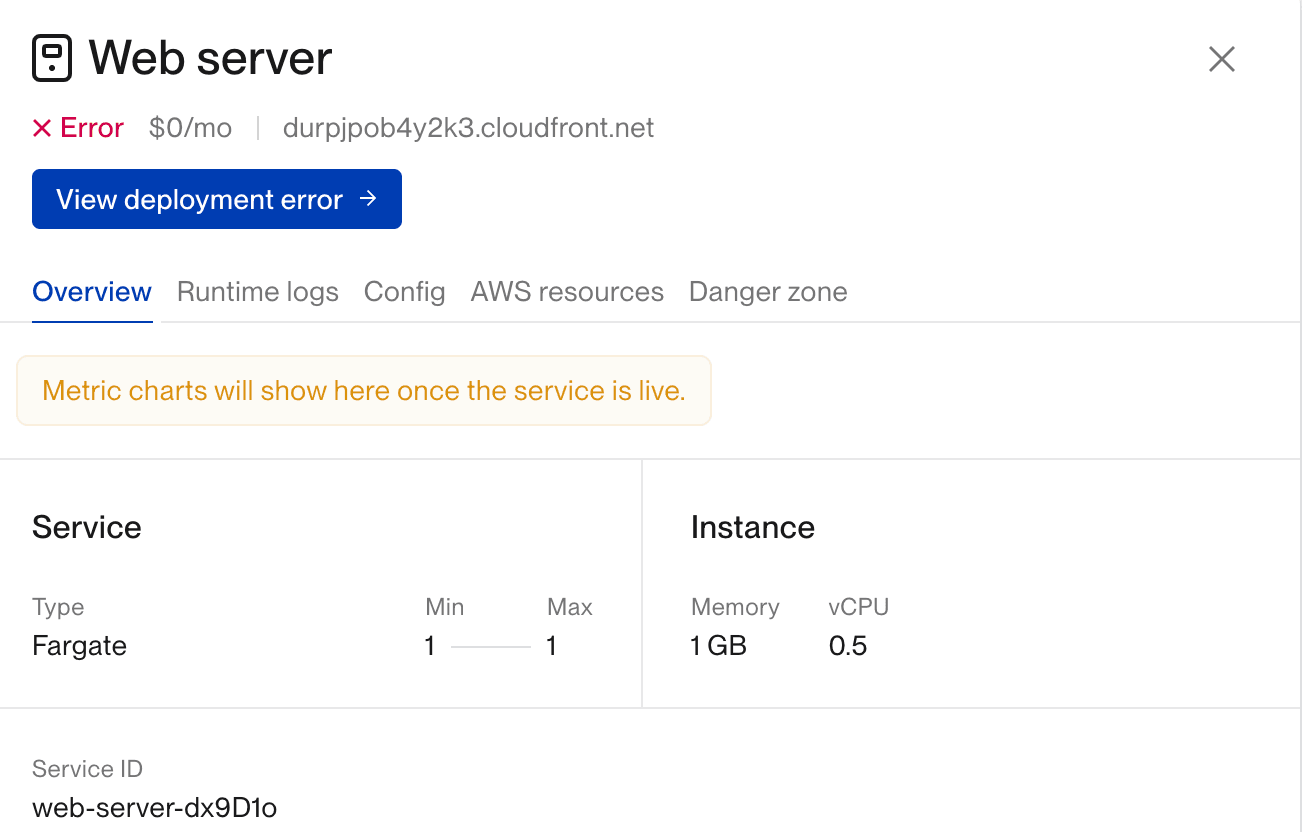
To find the deploy logs, check your environment in the Flightcontrol dashboard. If you have a successful build and a failed deployment, you will see the View deployment error button, similar to the following screen:
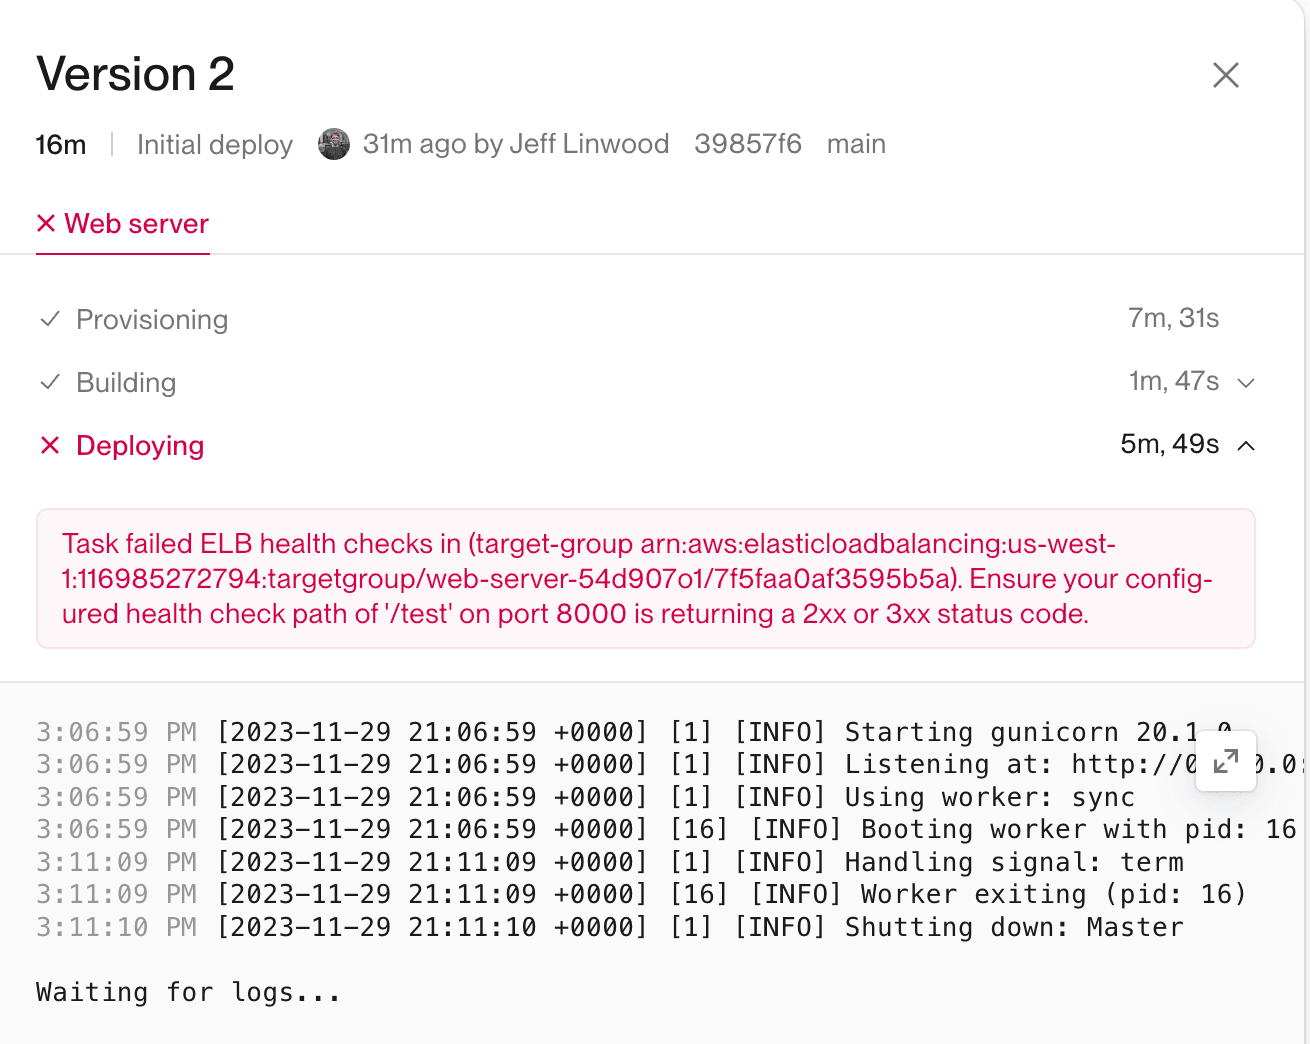
After clicking the View deployment error button, the Deploy Logs will appear for you to inspect the logs, such as the following screen:
If your deployment was successful, and your application started serving traffic, you will not see the button for deployment logs. Instead, you can view the runtime logs for your application.
Runtime Logs
Runtime logs show the output from your application’s services, running on the ECS cluster. These logs are stored in AWS CloudWatch, and you can view them in the dashboard.
Click the service you are interested in (Web Server or Worker), and then click the Runtime logs tab to view the logs. The logs will not be in realtime, but will be updated in small batches.
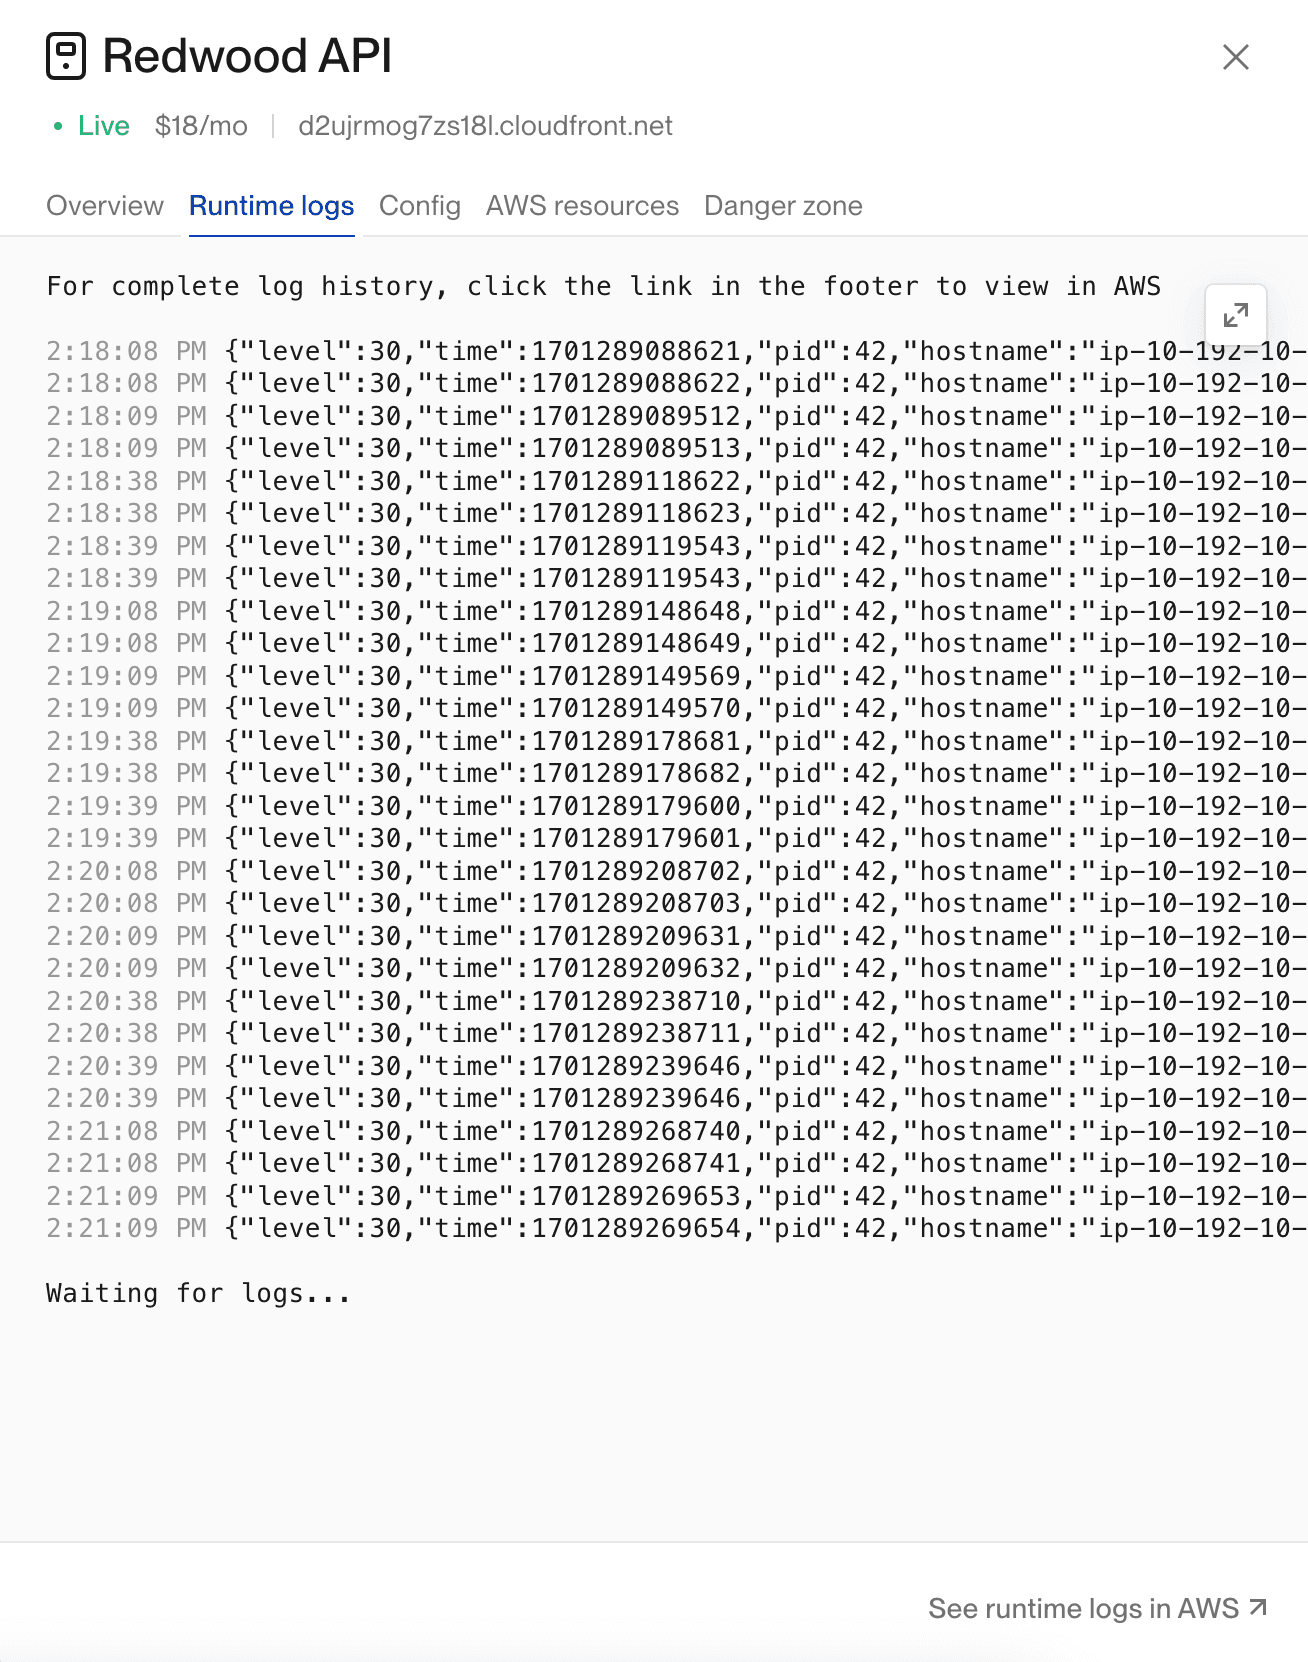
If you would like to view the runtime logs in the AWS Console, click the See runtime logs in AWS button at the bottom of the logs.
Viewing Runtime Logs in the AWS Console
If you do want to view the runtime logs in the AWS Console, the CloudWatch screen will show the list of log streams - the most recent deployment will be at the top.
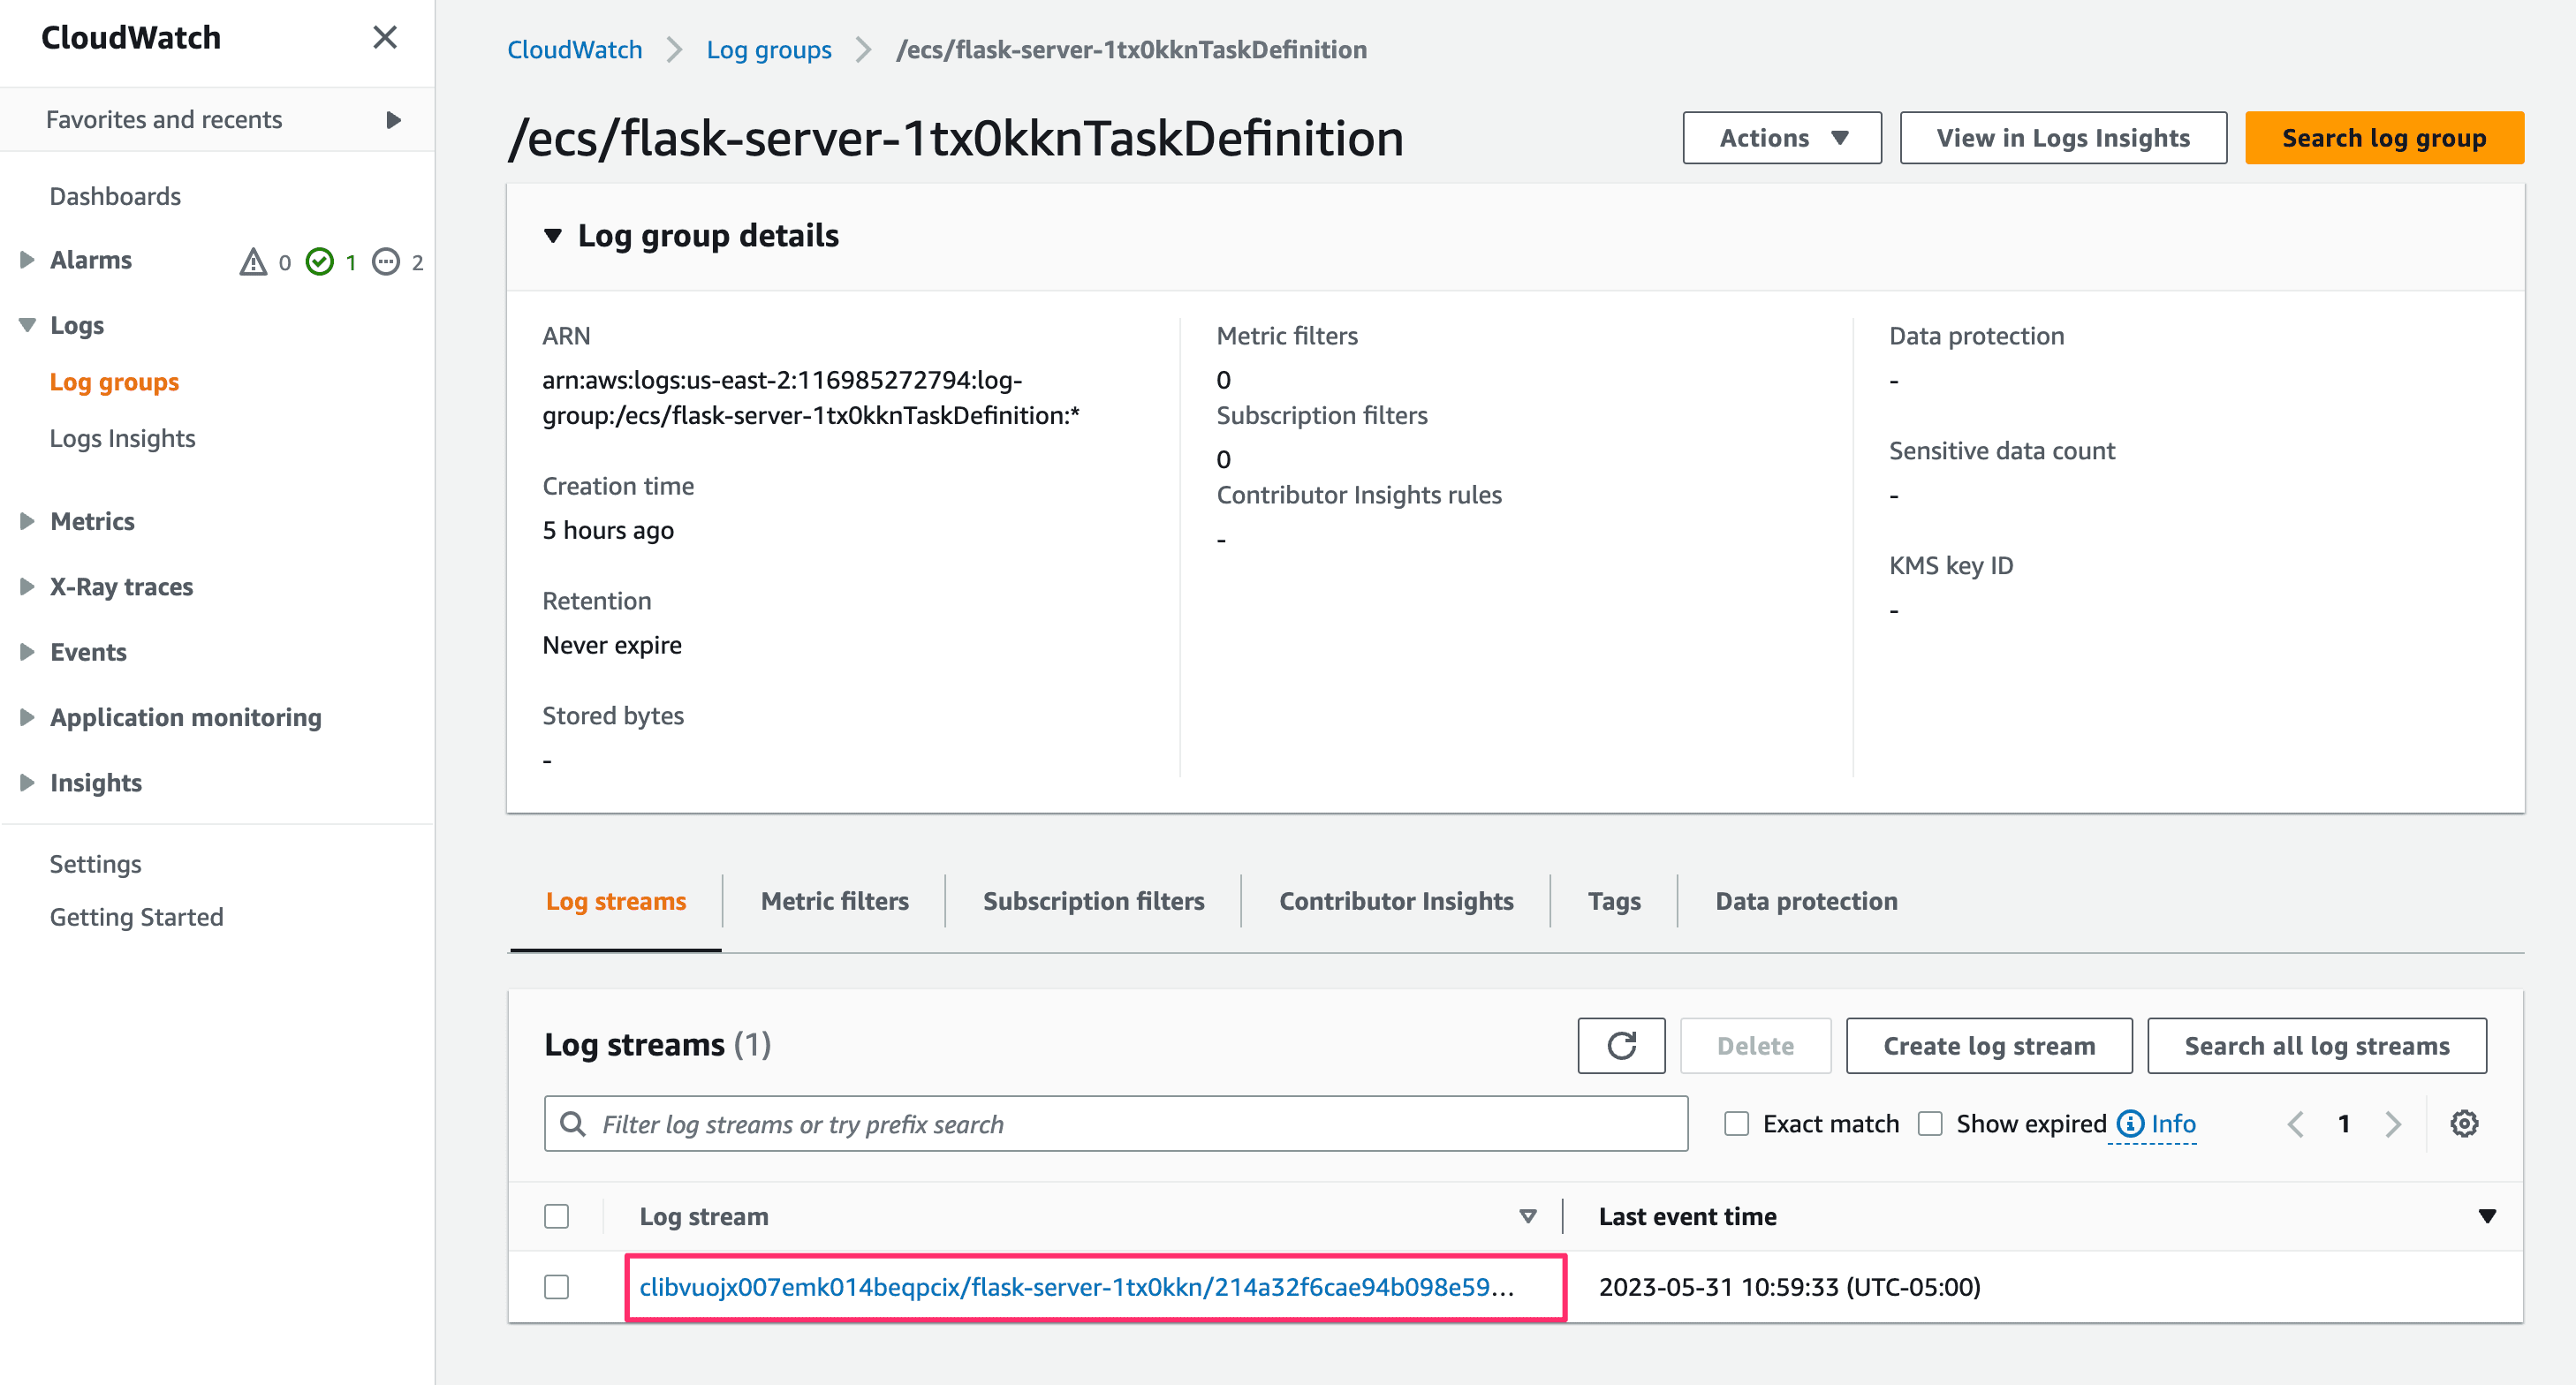
Choose one of the log streams to view the log events (typically, the latest stream is at the top). Each line printed to standard out by the application will be shown as a separate log event with a timestamp.
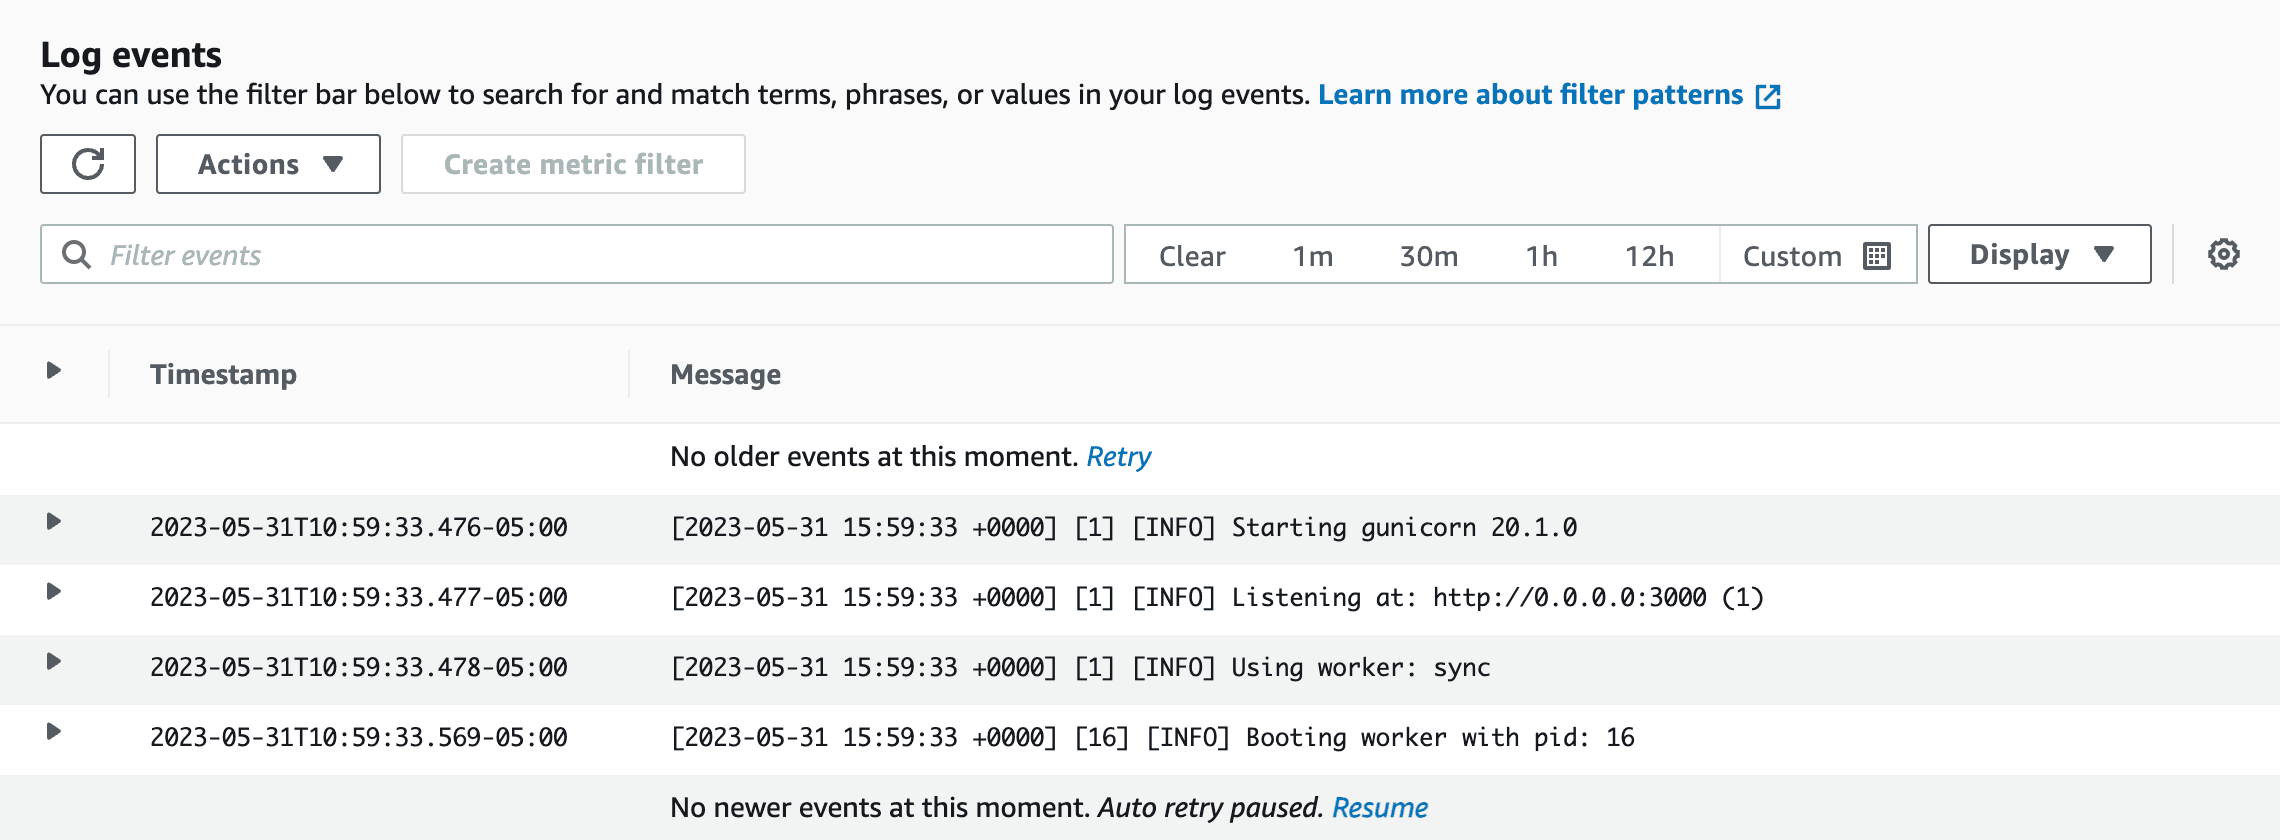
You can use the standard CloudWatch functionality to filter log events by specific text or a date range. If you desire, you can also view the logs as plain text as well, to get more horizontal space for each row.
Each instance of your application will send information into your runtime logs, so these can be noisy. In addition, the load balancer sends a health check request to your servers (every 60 seconds, by default), so you will likely see a log event for each of these health checks.
Using the AWS CLI to Tail Runtime Logs
If you would like to see your runtime logs in a tail environment, you can use the AWS Command Line Interface (version 2) to view the logs.
You will need to install the command line interface (the aws command) and configure it with your AWS credentials. You can find more information about this in the AWS CLI documentation.
Once you have the AWS CLI installed and configured, you can use the following command to tail the logs for a specific service:
aws logs tail <group-name> --region <region> --followAn example of this would be:
aws logs tail /ecs/flask-server-1tx0kknTaskDefinition --region us-east-2 --followWith the output of:
2023-05-31T21:28:30.247000+00:00 clic7vn8n0odur72bdbpoqvtl/flask-server-1tx0kkn/9796db1e2ac24761b456e686761a55ac [2023-05-31 21:28:30 +0000] [1] [INFO] Starting gunicorn 20.1.0
2023-05-31T21:28:30.248000+00:00 clic7vn8n0odur72bdbpoqvtl/flask-server-1tx0kkn/9796db1e2ac24761b456e686761a55ac [2023-05-31 21:28:30 +0000] [1] [INFO] Listening at: http://0.0.0.0:3000 (1)
2023-05-31T21:28:30.248000+00:00 clic7vn8n0odur72bdbpoqvtl/flask-server-1tx0kkn/9796db1e2ac24761b456e686761a55ac [2023-05-31 21:28:30 +0000] [1] [INFO] Using worker: sync
2023-05-31T21:28:30.252000+00:00 clic7vn8n0odur72bdbpoqvtl/flask-server-1tx0kkn/9796db1e2ac24761b456e686761a55ac [2023-05-31 21:28:30 +0000] [16] [INFO] Booting worker with pid: 16
You can get the exact service name to use by clicking on the “Runtime Logs” button in the Flightcontrol dashboard to go to the AWS CloudWatch console.
In the screenshot below, the group name is /ecs/flask-server-1tx0kknTaskDefinition:
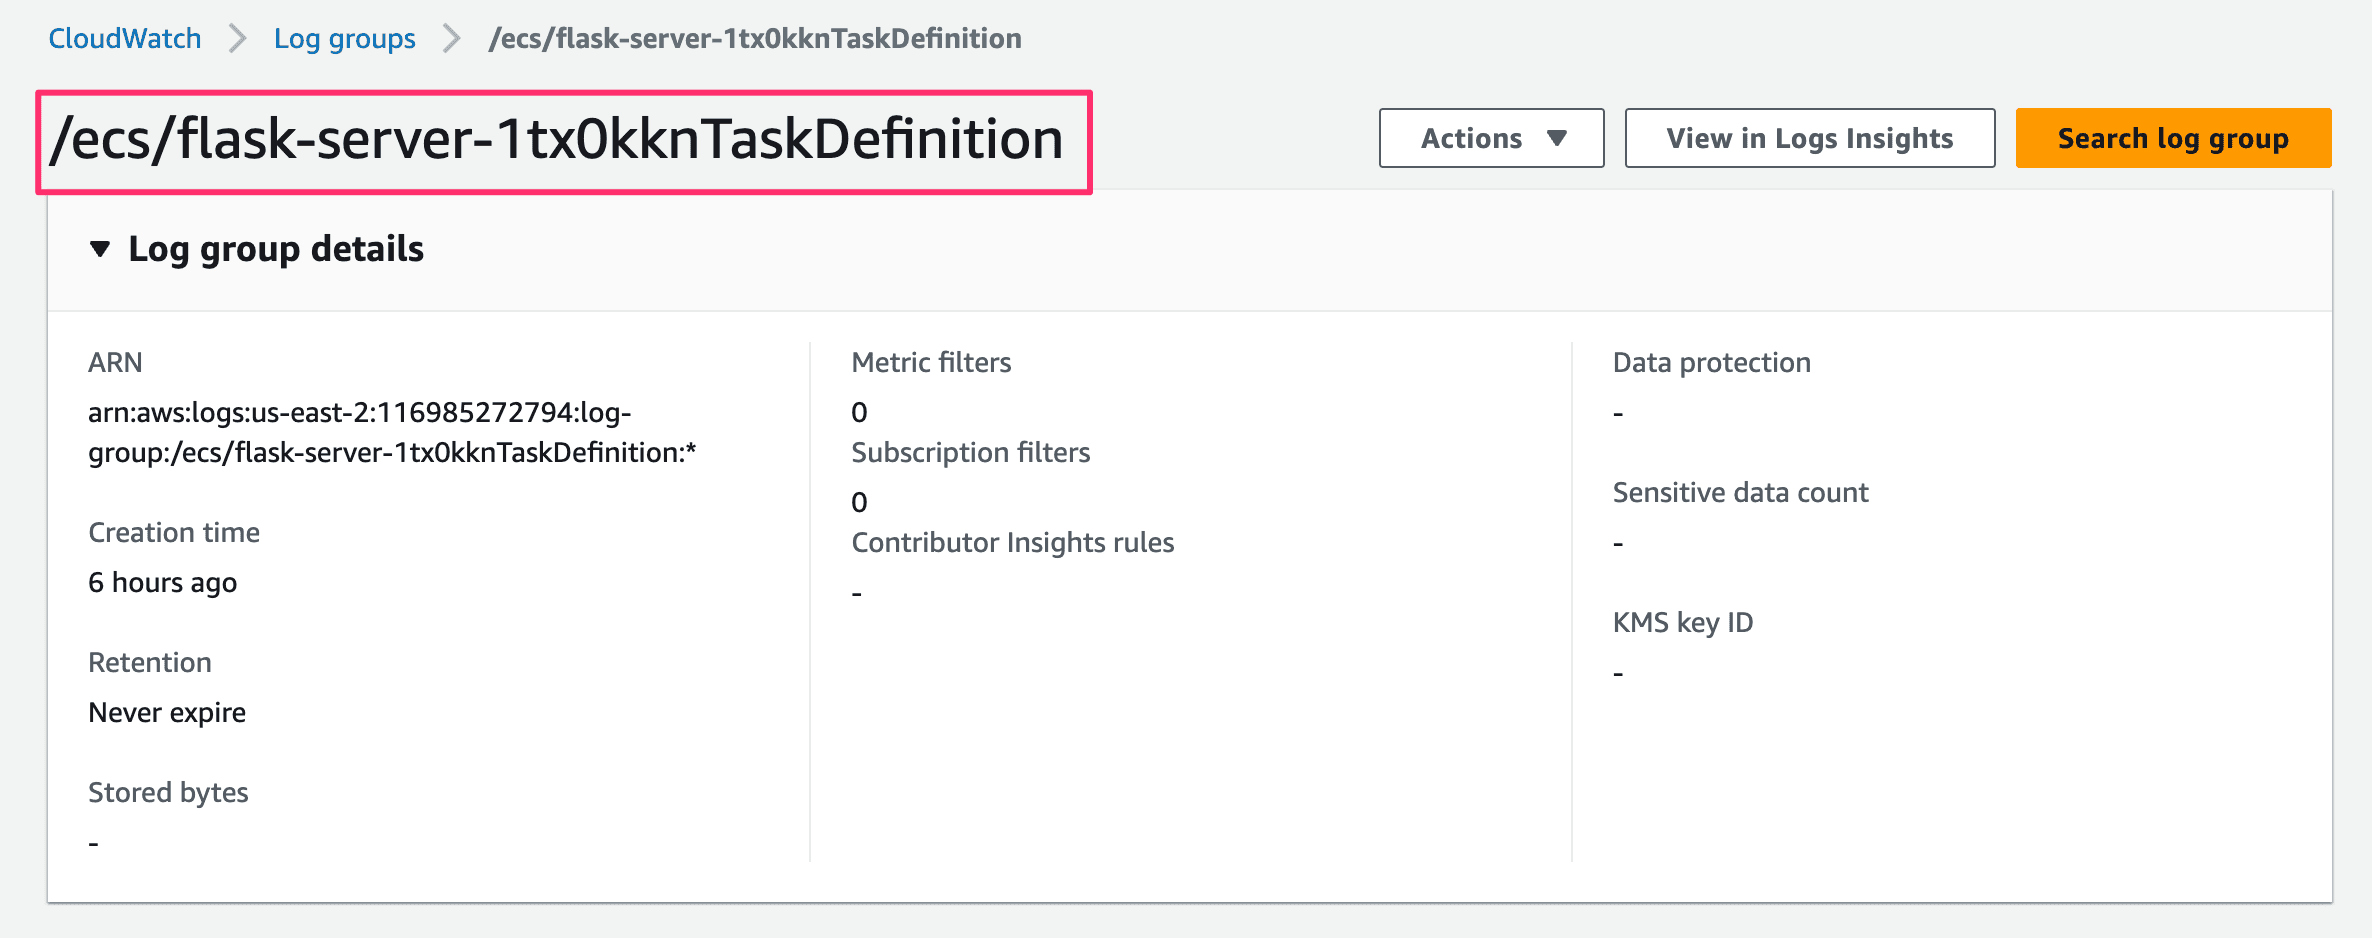
Because Flightcontrol uses the same ECS Task Definition for each deployment, you can use the same group name for all deployments of the same service.
Next Steps
You can use any other tools that work with CloudWatch logs for monitoring your deployments - Flightcontrol does not limit your access to the logs in any way.
When you write your applications, if you would prefer to send your logs to another service (such as a Splunk server), that is also possible, and not limited by Flightcontrol.